Identify and communicate opportunities to remove waste from your supply chain
Value Stream Maps are a powerful way of of identifying and communicating big opportunities for increasing your return on total assets.
We create Value Stream Maps using an approach that has been modified for the process industry (food & beverage, liquids, sheet goods, solid & fluid packaging operations).
Value Stream Mapping as a type of modelling process with 4 steps;
select a Discrete Part of the supply chain based on a business opportunity
map the Current State
create a Future State showing locations of the biggest benefit
Process Mapping Used to represent Flow Lines within a process factory.
Supply Chain Level Value Stream Mapping
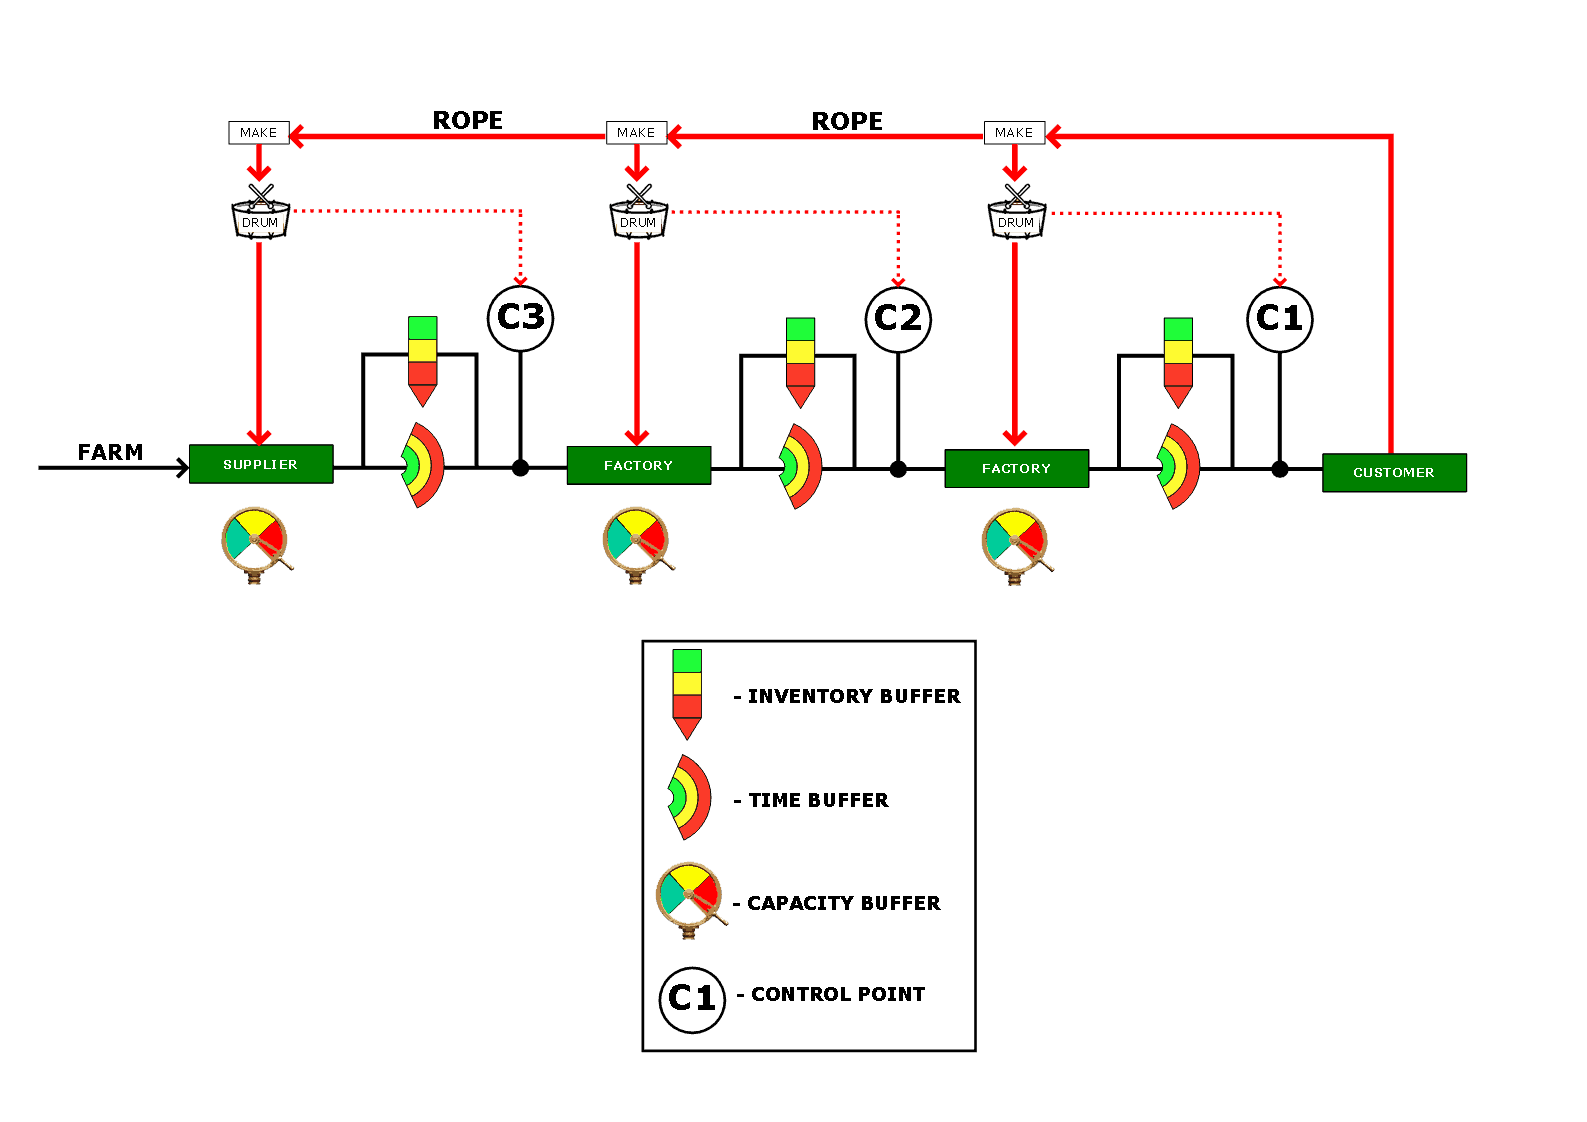
A Value Stream Map at the supply chain level is used to show a total end-to-end supply chain. A simplified schematic is shown below.
The biggest issue with most supply chains is that each buffer is controlled by different people or departments. Consequently buffers fight against each other as the people controlling them strive for different, localised, performance outcomes.
Maximum flow for the supply chain is only achieved when the performance of each buffer is monitored and adjusted according to the needs of the entire supply system.
The measure of success with this Value Stream Map, is the positive impact it has on the ROI. To achieve this, improvements are identified on a Future State map. Metrics identified in a supply chain level Value Stream Map include;
Lead time
Inventory Turns
Inventory carrying costs
Perfect-order execution
Demand Amplification
Quality Performance
Factory-Level Value Stream Mapping
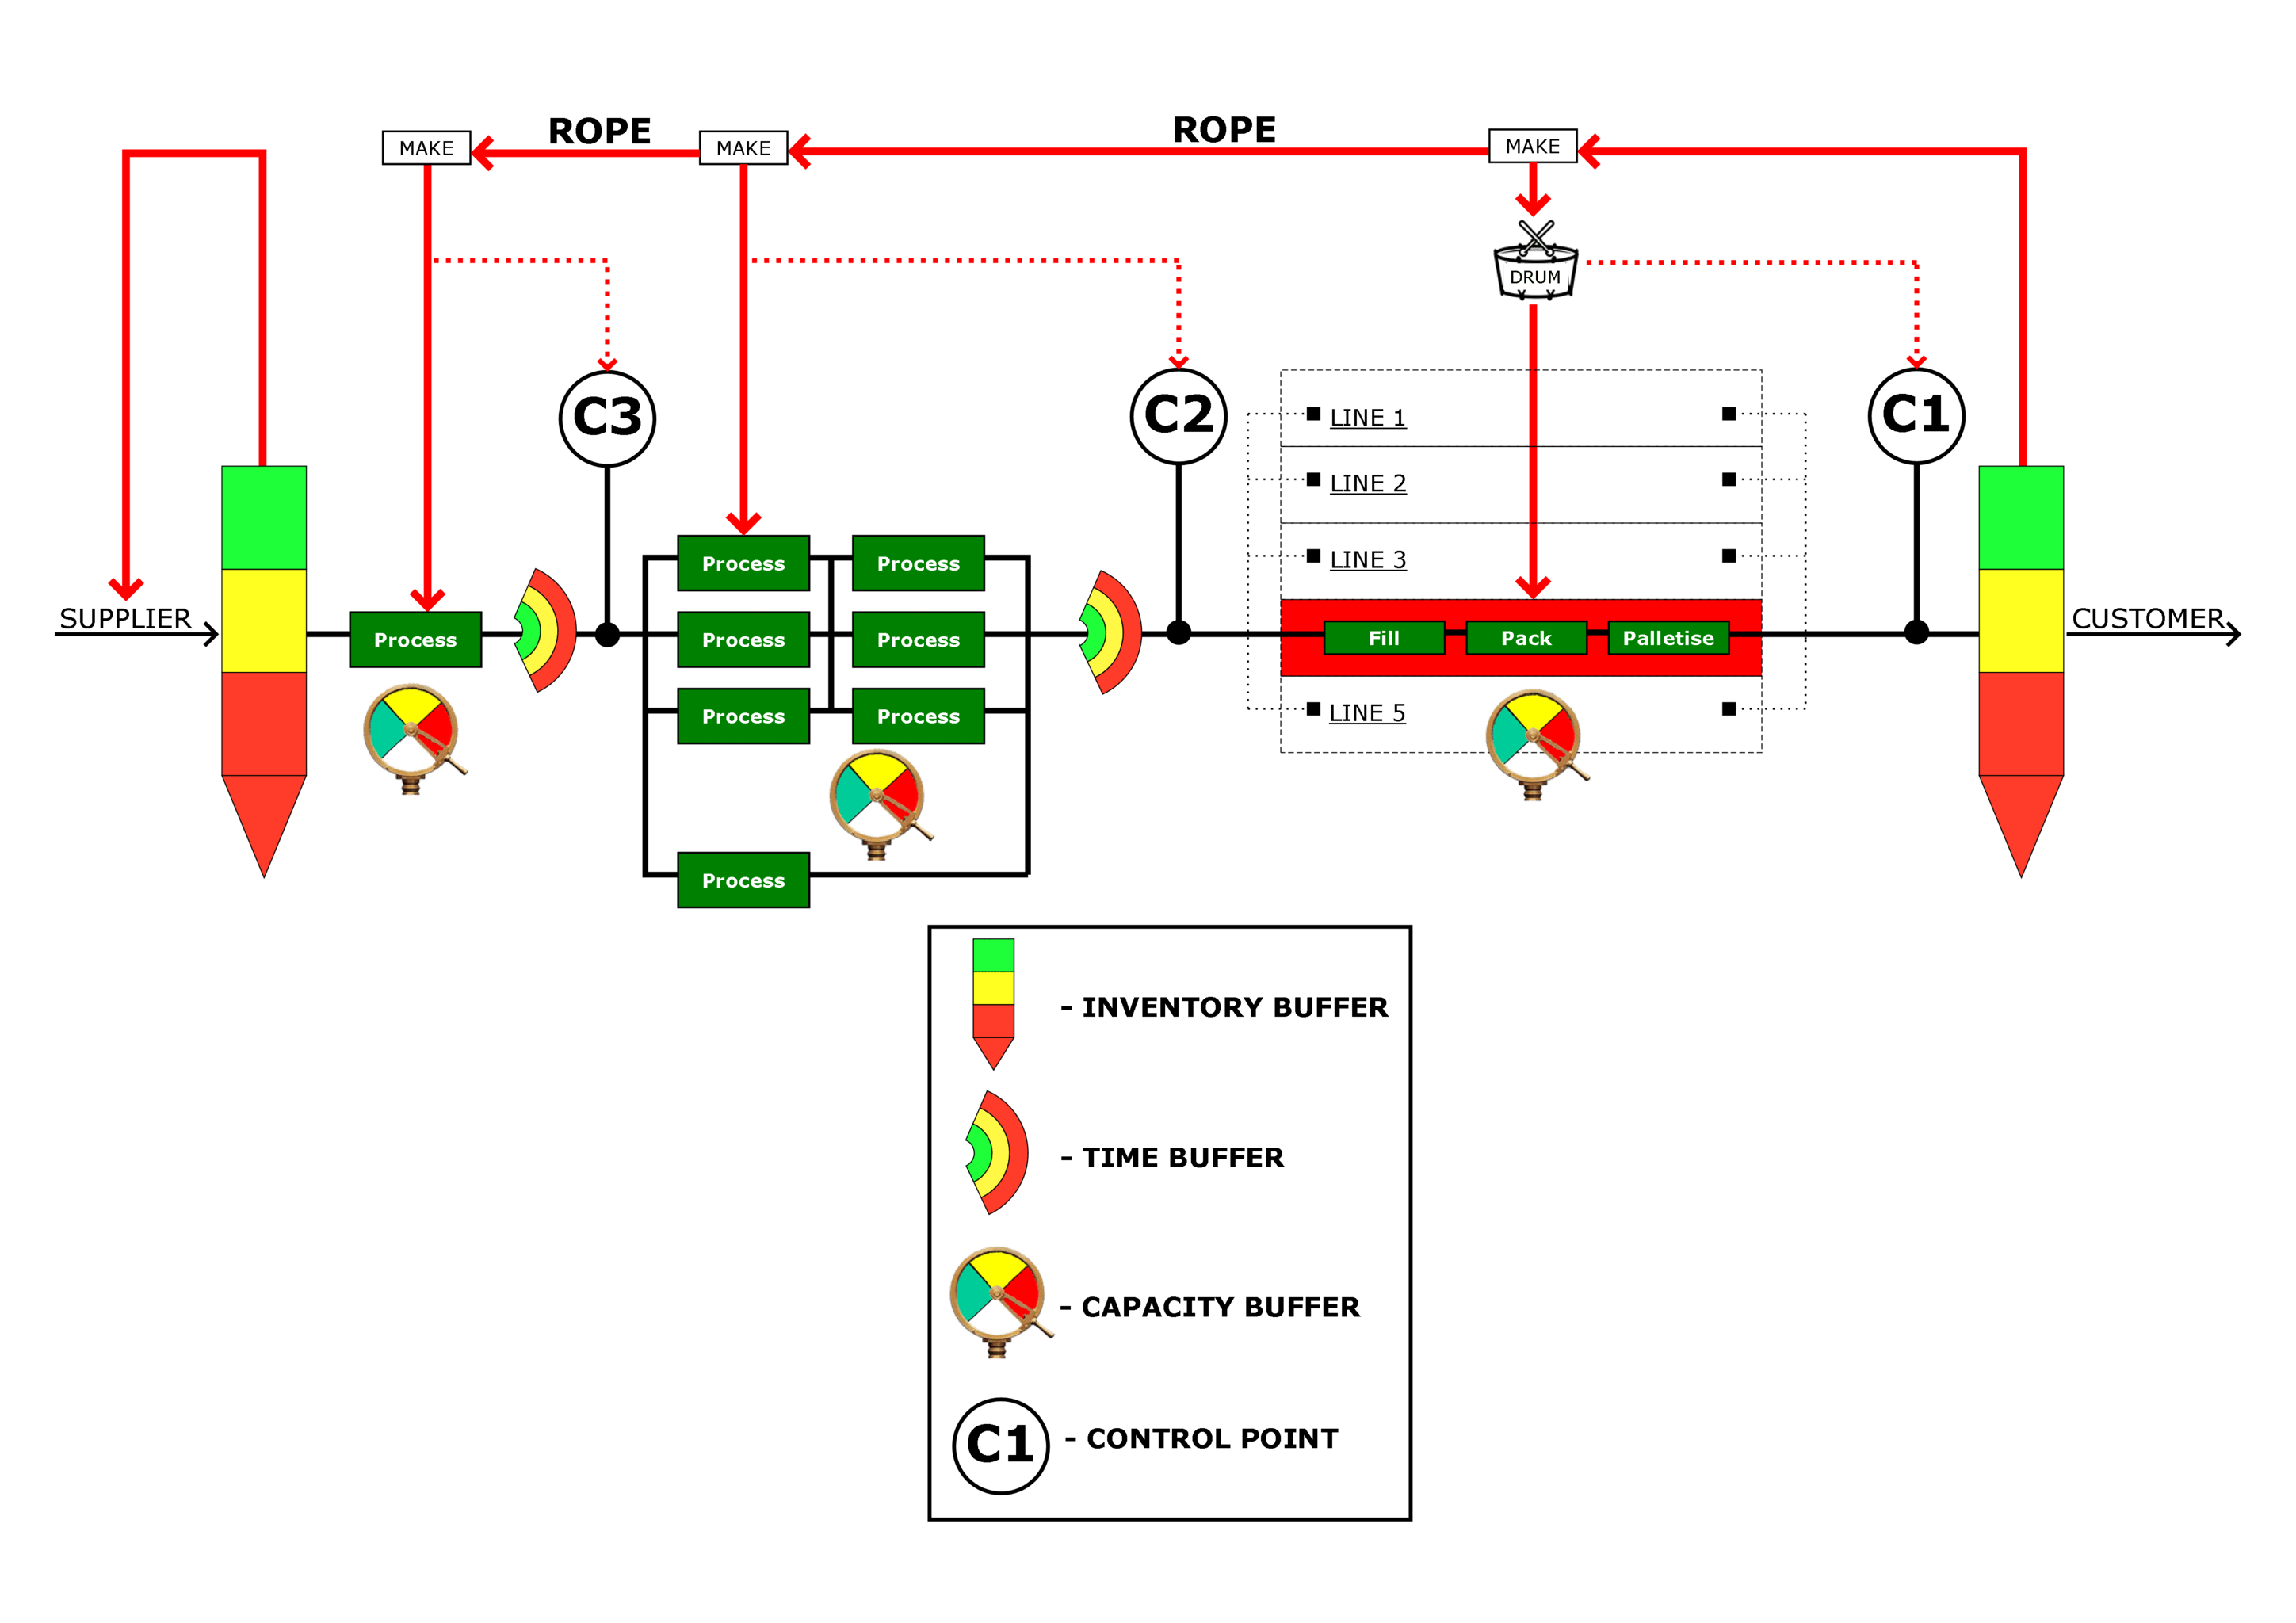
A simplified Factory-Level Value Stream Map is shown below.
For high technology process industries, the drum of the supply chain is usually located at the company-owned, or 3rd party, factory. The successful operation of the supply chain is determined by how well buffers are regulated upstream and downstream of the drum so as to maximise the flow of raw materials and finished products to the customer.
A Factory-Level Value Stream Map is used to identify high-value improvement opportunities within a factory.
Metrics used in a Factory-Level Value Stream Map include;
Every Product Every (EPE)
Average UpTimes (OEE)
Crewed time
Usable time
Utilised time
Average Instantaneous Rates
Average Efficiencies
Productivity
Losses
External defects
Process Mapping
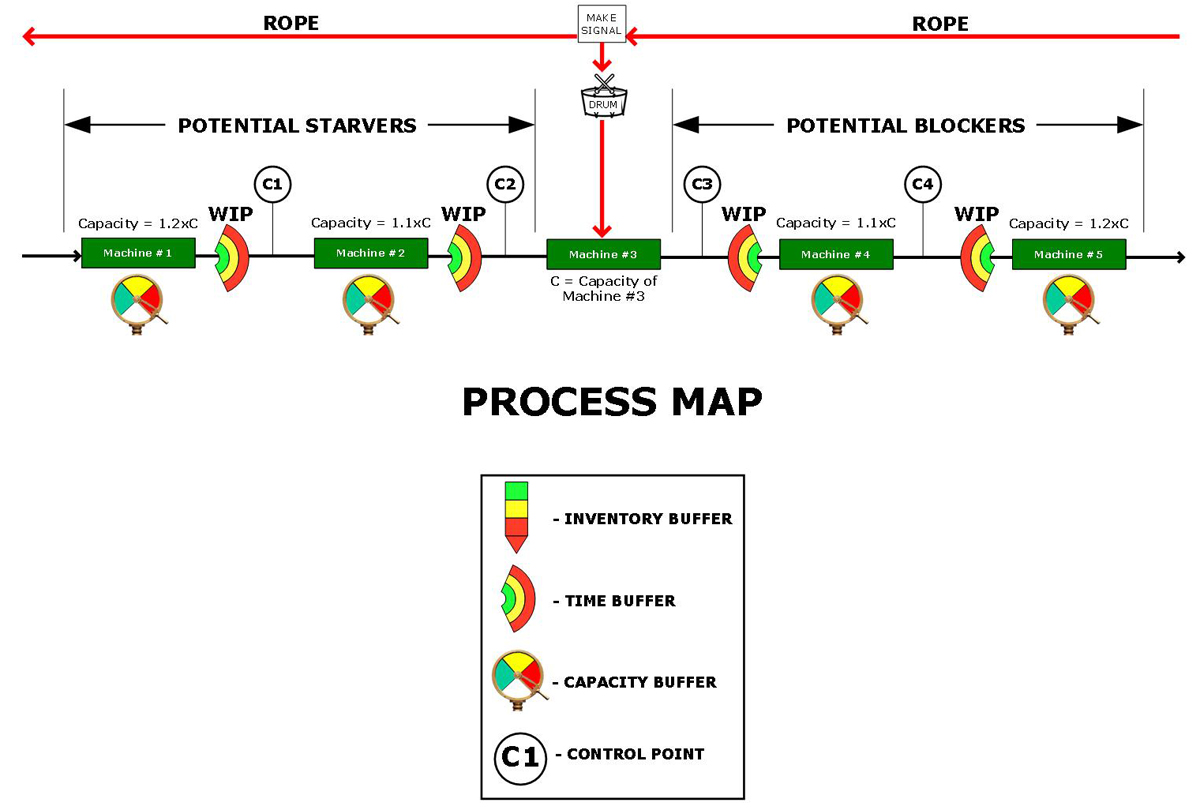
A simplified Process Map is shown below.
A Factory Level Value Stream Map (above) is made up of a number of processes.
In the process industry these processes are mostly flow lines.
A Process Map is used to identify the running characteristics of a process under different running conditions.