A system to manage bottlenecks in manufacturing supply chains was codified in the late 80’s by Dr Eliyahu Goldratt, and introduced to the world when he published his first book called, The Goal, in 1984. This system is known as the Theory of Constraints (TOC).
Goldratt was a physicist and he used his understanding of pure maths and statistics to create a logical approach toward supply chain management that went well beyond his many introductory business novels.
It would be an oversimplification to say that Goldratt’s work was all about bottlenecks but he did help businesses understand the nature of restrictions within a supply chain and how they can be identified and resolved.
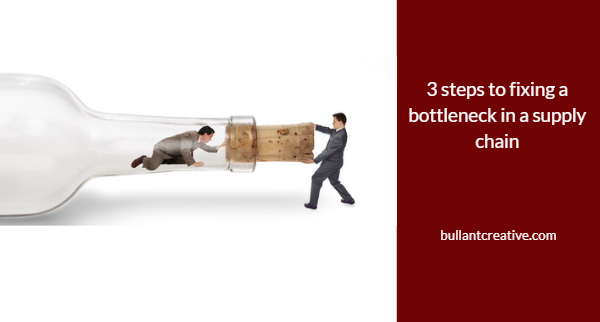
We lean on Goldratt’s work to define these 3 steps to fixing a bottleneck in a supply chain.
Step 1 – Define a bottleneck and its ideal position in a supply chain
The diagram below shows a healthy supply chain where the bottleneck is the customer.¹ This is the best place for a bottleneck in a supply chain because it ensures optimum delivery performance.
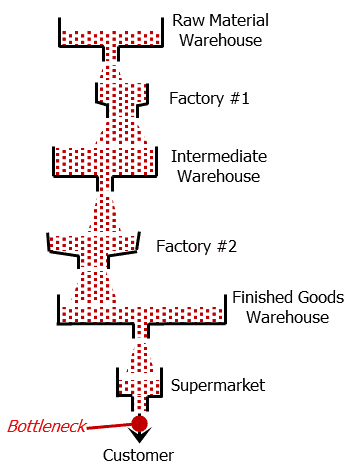
The important characteristics of a bottleneck are;
- flow is slowed by the bottleneck
- material accumulates before the bottleneck
- subsequent steps in the process are starved
Step 2 – Locate the bottleneck in the broader supply chain
To illustrate the behaviour of bottlenecks, and the nature of bottleneck management, I’ve used an actual case study.
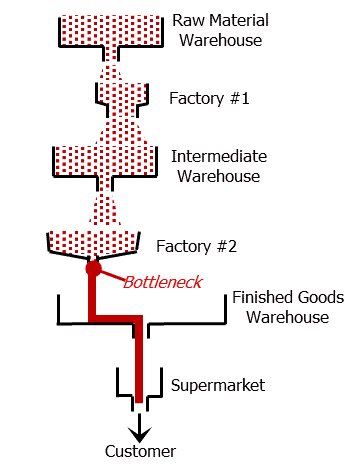
The supply director was suddenly informed that supermarkets were threatening to de-list a product because of exceptionally poor delivery performance. The supply director asked the planning team to represent the current state of the supply chain using simple funnels.
The bottleneck was identified at Factory #2 because material was accumulating in the intermediate warehouse (before the bottleneck) and the finished goods warehouse was being starved of product (after the bottleneck)
Step 3 – Locate and fix the bottleneck at the factory or warehouse
The supply director organised a teleconference with the team at Factory 2 and asked them to create a similar diagram for their factory.
The diagram was created for the only production line in Factory #2 that ran the product that was exposed to delisting.
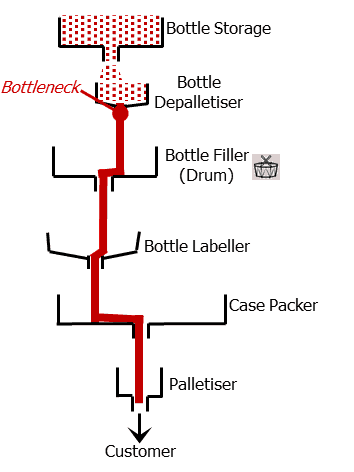
Another teleconference revealed that the bottle supplier for this product had been changed 3 weeks prior and the bottles had a high defect rate causing constant crashes at the bottle depallestiser.
The supply director marshalled his buying team into action and came up with a short and medium-term strategy to rectify the situation.
¹ – the credit for this diagram goes to Philip Marris, founder and owner of Marris Consulting, France.