A good quality factory schedule is one of the most important factors in minimising costs and creating a firm foundation for continuous improvement. Yet many factory schedules are driven by the knowledge of just one scheduler, without much oversight by senior production management.
In this post we will explore the important parts of a scheduling cycle and provide a few rules of thumb for process factories.
Note: If you don’t think you have a standard scheduling cycle (i.e. a template that is used periodically by a scheduler to rough out a new scheduling cycle) then just ask the scheduler. If it isn’t documented then it’s probably just locked away in the schedulers head.
1. Recurring Cycle
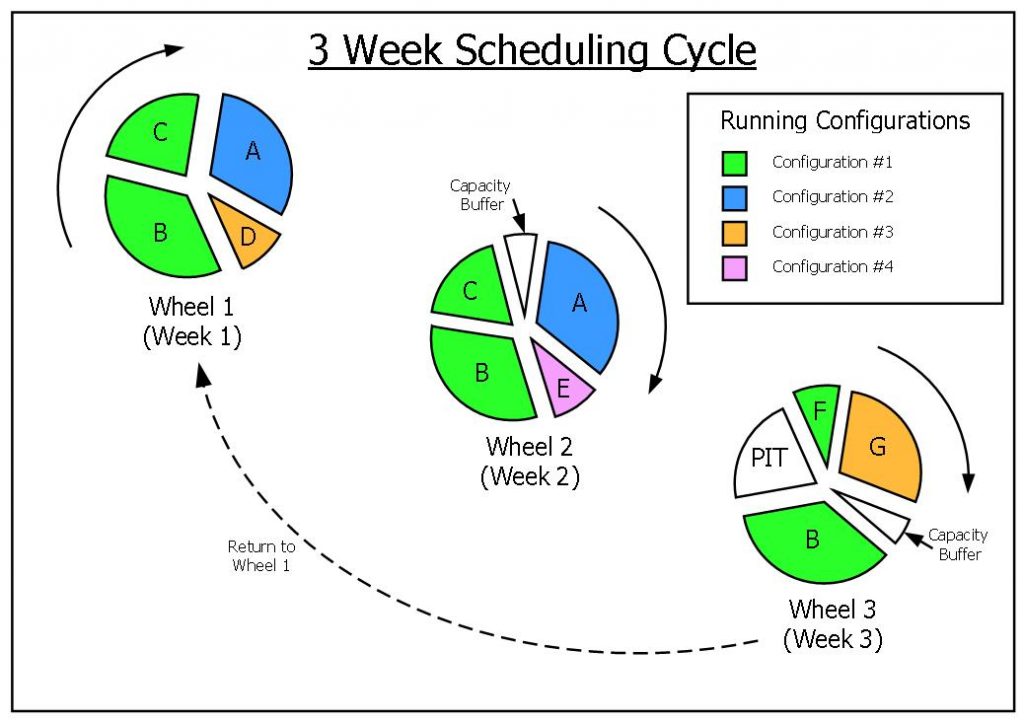
Product portfolios in the process industry are complicated. Paradoxically this makes it easier to create a recurring scheduling cycle for a given production line. If different and complex products are always required to run on the same complex processing line then there is always a logical way to order these product runs (see next heading). If the average demand for each product is also calculated it becomes a matter of desk work to create a number of weekly cycles as shown below.
These are known as Product Wheels and in the process industry there are usually 3 or 4 weekly Product Wheels in a standard recurring scheduling cycle.
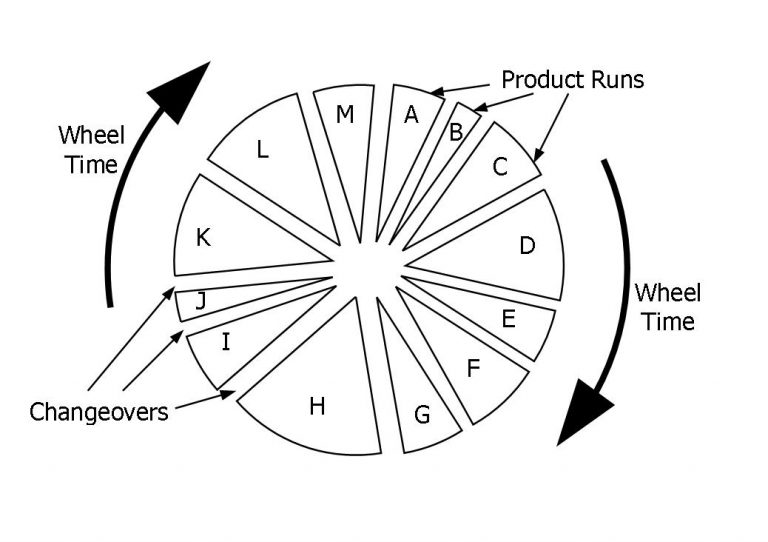
2. Product Runs
The duration of each product run is simply the instantaneous rate at the scheduled machine on a processing line multiplied by the average running efficiency.
The instantaneous rates used in production schedules are notoriously wrong and yet they are often easy to ascertain. They run foul of a view that they should be made “stretching” when the reality is that instantaneous rates in complex processing environments are more a function of equipment design than employee training or motivation (although obviously people management is an important enabler for production performance).
Running efficiency is different to Overall Equipment Effectiveness (OEE). Running efficiency excludes variables such as changeover times and line availability. Running efficiency is easy to calculate with enough historical product run data. It is simply cartons produced divided by the cartons that could have been produced at the instantaneous carton rate.
In the process industry there are up to 250 product runs in a recurring, 3-week schedule cycle. The duration of each product run can be anywhere between 30 minutes and 6 hours.
3. Run Configurations
Each processing line usually has between 15 and 30 ways it can be set up or configured. These are known as running configurations.
Each product run is aligned with a single running configuration. But, one running configuration can be used for many different product runs. As the Product Wheels above demonstrate, one running configuration can often account for a disproportionate volume of product (see Running Configuration #1 in the graphic above).
In fact the most important running configuration on a processing line will usually account for over 40% of the total time in a recurring cycle. It follows that it is extremely important to know this running configuration intimately and concentrate on it’s improvement.
4. Changeovers
Changeover time is that time taken to change from one product run to another. The time is measured at the scheduled machine.
All changeovers are not created equally. It is usually an easy task, once the standard Product Wheels have been defined, to list the frequency and duration of each changeover according to the “from” and “to” products.
If there are 50 changeover types in a recurring cycle then usually the top 4 changeover types (as determined by the “from” and “to” products) will account for 30% of the total changeover time. It is important to concentrate on improving those changeovers that contribute the most lost time in a Product Wheel.
Total changeover time in the process industry accounts for approximately 10% of the total recurring cycle time.
5. Sequence
If you need to run say a black and a white product within a recurring cycle then it makes sense to run the white product first to minimise the cleaning and changeover time.
If, out of say 50 changeover types (see above) on a production line, there are 2 or 3 changeovers that are exceptionally long then it makes sense to always do these changeovers during Process Improvement Times (see below).
These are just 2 examples of the way the characteristics of products or processes determine the sequence that best suits a particular product portfolio. Schedulers always run to a sequence (whether they can articulate it or not) and that has usually developed with many interactions with senior production employees.
There are huge cycle time benefits to be had by formalising and optimising the sequence used in a recurring schedule cycle.
6. Process Improvement Time (PIT)
Process Improvement Time can include any or all of the following
- Improvement team activities
- Maintenance
- Cleaning
- Off-line set-up
- Meetings
- Team building
7. Capacity Buffer
Finally there needs to be an allowance for variability; both supply (factory) variability and demand variability.
Some managers deny that any allowance needs to made for supply variability but data from many factories shows that for a medium technology factory with an average reliability there is about 10% variability against schedule target for each product run. That is to say that actual production can be 10% greater or 10% less than the original scheduled target for a single product run.
The good news is that if there are 10 or more product runs in a row then we can apply some statistical rules. The variability of this total group (i.e. > 10 product runs in a row) is half the variability of the single run or 5%.
If we assume a similar variation for demand we get another 5%.
Finally we can apply a safety factor of say 50% for Murphy’s law so our total capacity buffer would be (5% + 5%) X 1.5 = 15%.