
You know the signs, the factory keeps missing production schedules and you keep depleting finished goods inventory. Its now so bad that you are missing vital customer orders and some customers are threatening to delist.
This is a common story and here we use a scenario based on actual events to illustrate how an understanding of Value Stream Maps and buffers can be used to fix the problem. Details have been changed to protect client confidentiality.
The basic factory level Value Stream Map for this particular factory is shown in the graphic below.
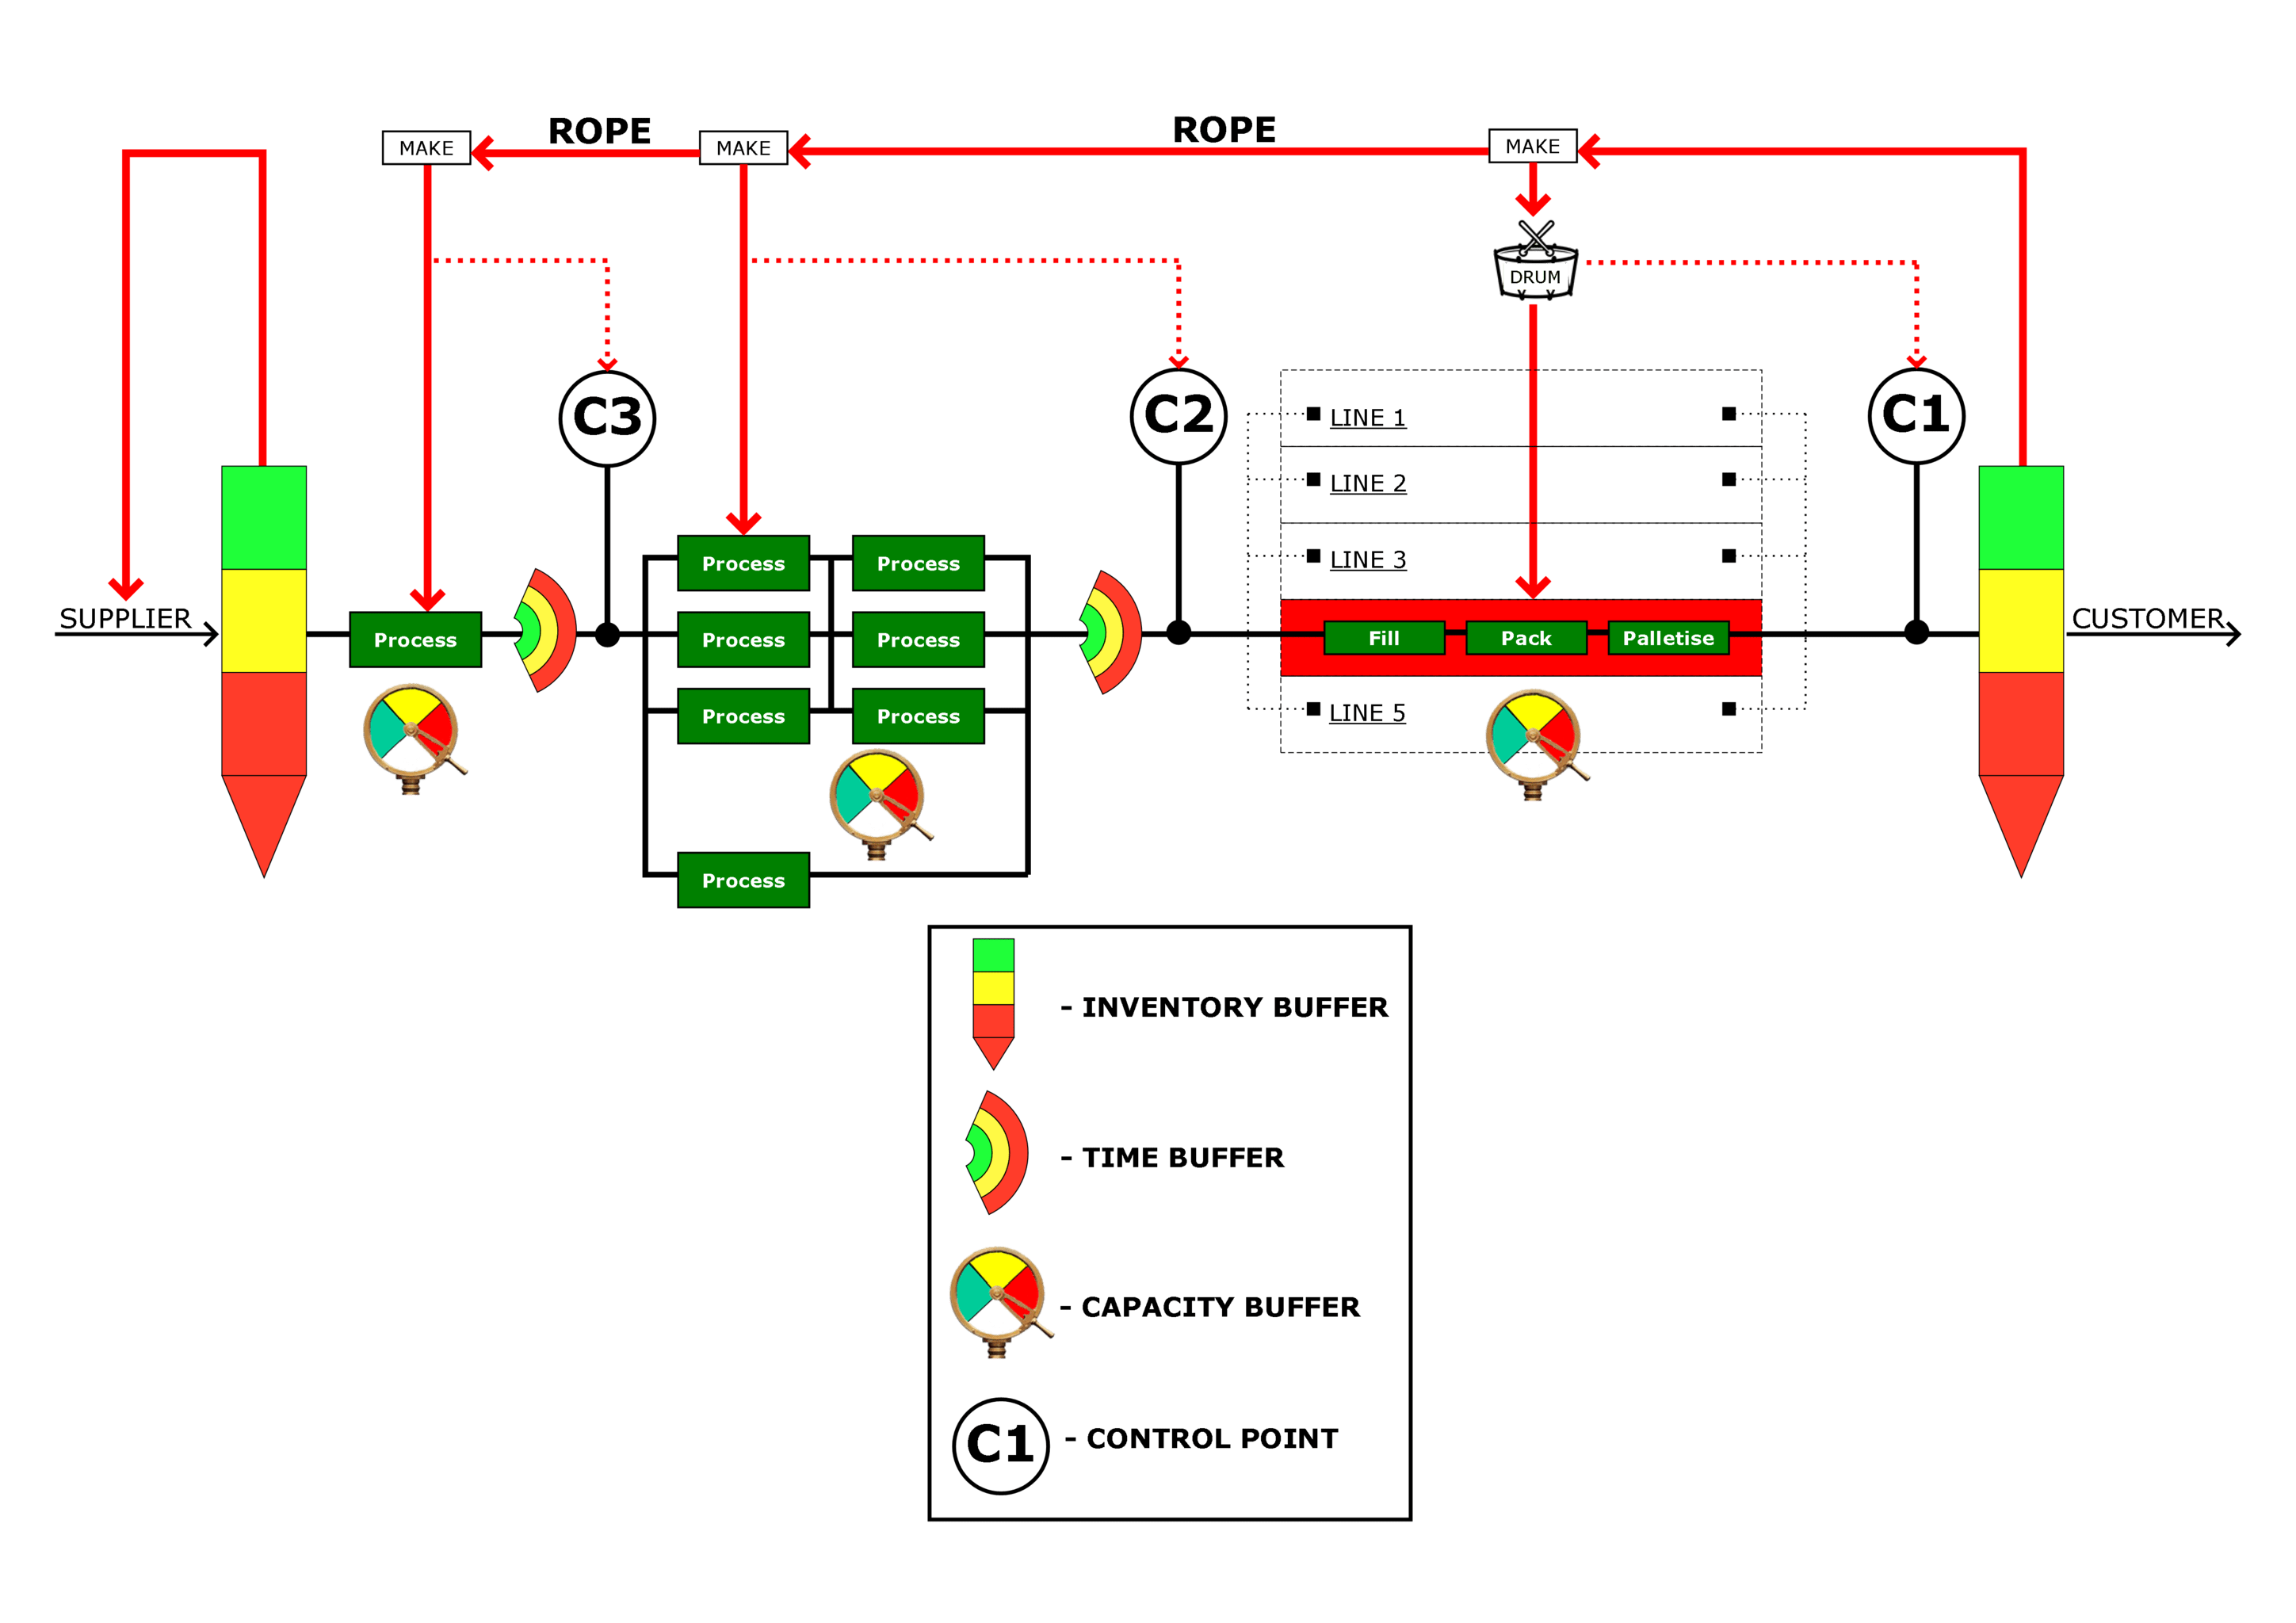
In the process industry, the drum or drumbeat of the supply chain is usually at the company-owned factory. The successful operation of the supply chain is determined by how well buffers are regulated upstream and downstream of the drum so as to maximise the flow of raw materials and finished product to the customer.
In this case there were five drums (packaging lines) at the clients factory. At the time, products being produced on line #4 had exceptionally low customer delivery performance, even though Inventory Buffers at the forward locations were placed strategically and were operating well.
The factory ran a Monday to Friday shift cycle although the site operating team had decided to use overtime on the weekends so that the Capacity Buffer on this line could be increased.
However the new Capacity Buffer was being exhausted almost every week, there simply wasn’t enough days in the week or available skilled employees to keep up with demand.
Consequently, Bullant Creative were asked to use the Bullant Filters to further increase the Capacity Buffer for the packing line, which worked. Hence the Inventory Buffer was restored and customer service returned to >98% very quickly and overtime levels were reduced.
Whilst completing the Bullant Filters it was discovered that the packing line was being starved of product about 20% of the time. This was measured at Control Point C2. At the time, there was no formal method for creating “Ropes” (schedules), from the Drum to the upstream processes.
We used Dynamic Modelling to confirm that the buffers (capacity and time) upstream of C2 were in fact sized correctly and big enough to supply the factory reliably. Therefore the starvation problem was an issue of sychronisation and so we used the information from the Dynamic Model to create a simple spreadsheet to generate more reliable make signals at the upstream processes.
The condition of the buffers, and metrics at the control points, continued to be updated on the factory level Value Stream Map each month. This confirmed an increase in performance.