Process factories (food & beverage, liquids, sheet goods, solid & fluid packaging operations) must satisfy the competing needs of high volumes, high variety and high variability. All of this in a capital intensive environment where throughput is limited by equipment rather than labour and where product changeover issues are very complex.
Process factory design is challenging however there is a structured way to go about it which delivers minimum cost and maximum business flexibility.
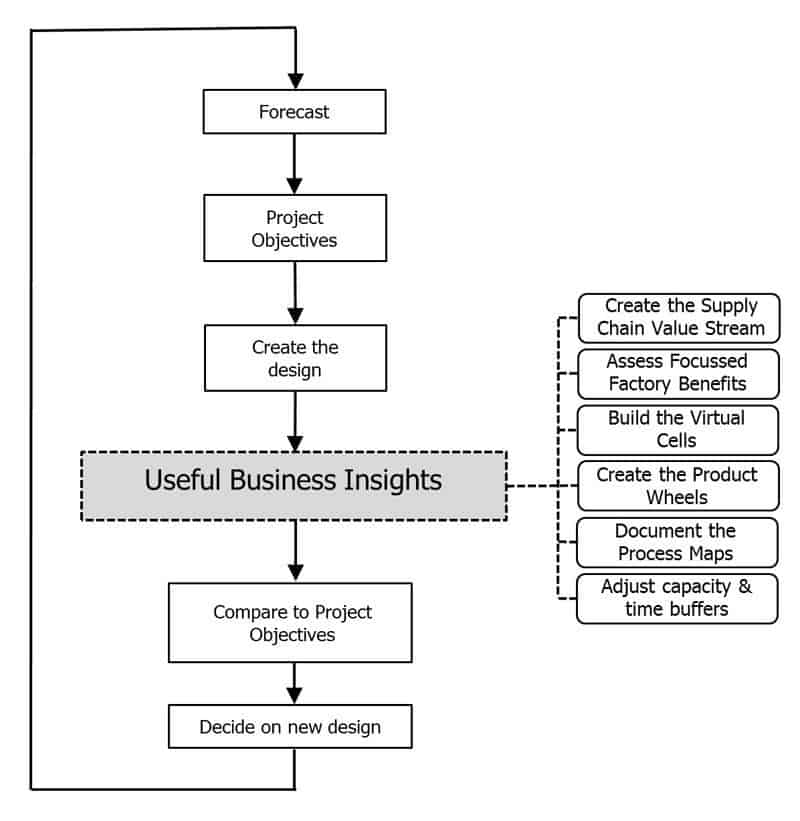
Factory design in the process industry is an iterative process (shown below) and there are 6 activities that help to create useful business insights during the design phase:
- Create the Supply Chain Value Stream
- Assess the focused factory benefits
- Build the virtual cells
- Create product wheels
- Document the process maps
- Adjust the capacity & time buffers
Create the Supply Chain Value Stream
Process factories are different to car factories (see our article 7 fundamental differences between food & beverage factories and car factories for more information) and some lean tools do not apply, such as Andons. Most of the tools do apply, albeit in a modified form.
One of the most important Lean tools during factory design is Value Stream Mapping although this tool must also be modified for the process industry.
We have given an overview of how we create customised, high level value stream maps for process industries in the following articles;
- 10 high-powered building blocks that change the way you look at your complex supply chain
- How to design a complex supply network for maximum flow and minimum cost
The need for a new factory will have evolved from a strong (sometimes very broad) business case. That business case should be converted into rudimentary supply chain Value Stream Maps showing both a current and future state.
These Value Stream Maps will show the total supply network design and how the factory will add value within that network. These maps should reference other strategic documents within the business case including an aggregate forecast, capacity/facility plan, a workforce plan and a supply chain plan.
Assess the Focused Factory Benefits
The concept of focussed factory has been around for a while (mid 80’s), particularly in the Lean literature.
This conceptual view maintains that each facility a company operates should be focussed to produce a particular type of product that is designed to compete based on a certain strategic plan.
For example a high end, low volume, high margin product should be made in one plant and a low end, low margin, high volume product should be made into another.
As another example, products requiring similar technologies should be grouped together to ensure that workforce skills are not diluted.
An un-focussed factory, making dissimilar products in one facility, will generally force a compromise between efficiency and flexibility. Problems will also arise because of the different requirements for labour, raw materials, equipment, training resources, and so on.
Sometimes however, it does not make sense to build seperate facilities; such as when businesses are making a low-cost entry into a different market. In this case the business should consider operating a plant within a plant. In other words, one facility may house different types of operations, each running independently of the others.
Build the Virtual Cells
Cellular manufacturing is a Lean concept that utilises U- or L-shaped arrangements so that one worker can operate several machines, as a way to optimise labour productivity. Because of equipment size and interconnectedness it is often impractical to arrange lines in the process industry into U- or L-shaped arrangements.
Process factories however, can still reap huge benefits by managing flow in a cellular fashion. Consider this typical process industry footprint¹;
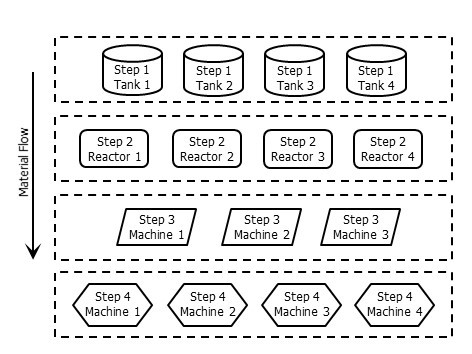
The quest for maximum flexibility will often push factory designers towards making as many links as possible as shown below;
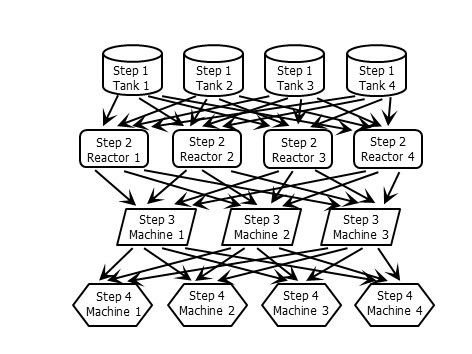
This inherent flexibility will always be exploited by operations personnel. This is because they (and almost everyone in the business) believe that utilising this flexibility maximises asset utilisation and minimises costs, although the opposite is usually true.
In this simple arrangement (above) there are 192 (i.e. 4 X 4 X 3 X 4) possible flow path combinations. As a result quality and costs suffer because;
- there are essentially 192 different processes that make root cause analysis very difficult (particularly where there is a lag in feedback e.g. customer complaints)
- WIP is often used to manage sequencing issues that makes visual flow management and automatic pull systems hard to implement
- performance improvement becomes very hard to achieve because of a lack of repeatable performance history on each of the 192 processes
- operator familiarity and cross-training on the different process combinations becomes difficult to maintain
- the ability to change paths when equipment fails means that there is less motivation to find root causes, further eroding long term performance improvement
A more thorough review of product mix (see product wheels below), volumes and product design will often identify opportunities to create virtual cells as shown below;
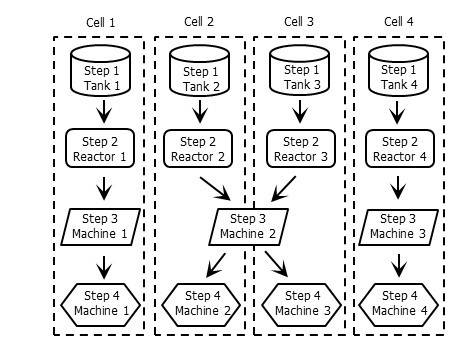
Creation of virtual cells (in this case we have gone from 192 lines down to 4) delivers the following advantages;
- flow usually becomes faster and definitely much easier to understand, visualise and manage
- flow tends to be much more continuous with minimum WIP for sequencing and therefore less handling losses and costs
- quality improves because variability is reduced and feedback is more immediate
- performance improves with operator consistency and more effective root cause analysis
- performance data becomes more reliable facilitating better improvement outcomes
Create Product Wheels
Factories in the process industry (i.e. food and beverage, liquids, sheet goods, fluid and packaging operations) have a number of very significant challenges when compared to the parts manufacturing and assembly industry;
- demand variation typically occurs over longer periods of time
- difficult and costly changeovers and associated losses on restart, make mixed model scheduling impractical within short periods
- labour flexibility across technologies is often problematic making this a limited means of absorbing demand variation
These challenges make application of Hiejunka (the Lean tool used for load leveling) impossible to apply effectively in the process industry.
However, designing a process factory without at least a preliminary view on sequencing and load leveling will mean that it will be over-designed for the maximum demand variation with associated cost implications.
Ex-employees from both Dupont™ and Exxon have recently released information on the unique load leveling techniques used in these processing businesses. These techniques fulfill the load leveling benefits offered by Heijunka while catering to the unique challenges found in the processing industry.
They both use a fixed-cycle-variable-volume technique which is captured in the product wheel concept¹
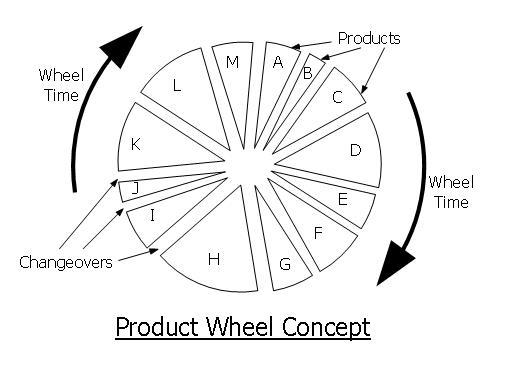
Product wheels are used to level demand and supply variation over a predetermined number of cycles.
The detailed methodology used to create robust Product Wheels is beyond the scope of this article. However, effective process factory design must include at least a rudimentary view on sequencing and load levelling so that the total operating capacity (ie. the capacity buffer) is not made too large.
Product Wheel design follows a 7 step process;
Step 1 – determine which workcentres or flow lines should be scheduled using product wheels
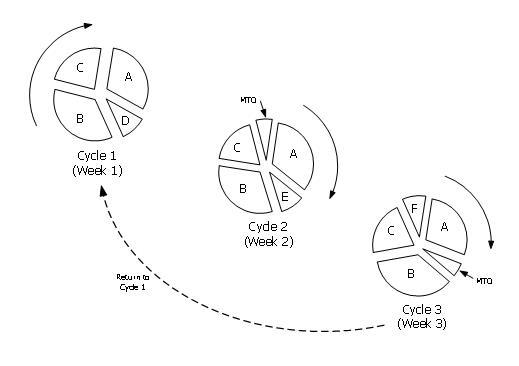
Step 2 – analyse product demand variability and confirm which products will be Make To Stock (MTS), Make To Order (MTO) or Finish To Order (FTO)
Step 3 – determine an optimum sequence based on unique workcentre or flow line characteristics
Step 4 – calculate shortest wheel time possible using trade-offs between available line time and Economic Order Quantity
Step 5 – calculate inventory levels required to support the wheels
Step 6 – repeat Steps 3 through 5 to fine-tune the design
Step 7 – create a visual display using a Product Wheel (above) or gannt chart
Document Process Maps
The process industry predominantly uses flow lines rather than the paced assembly lines used in the car industry. Refer to our article What is a flow line and how can it be manipulated to maximise performance? for more information on flow lines versus paced assembly lines.
When designing a process factory it is important to create a process map (which is essentially a Value Stream Map at the detailed production line level) that documents the capability of each flow line in a factory.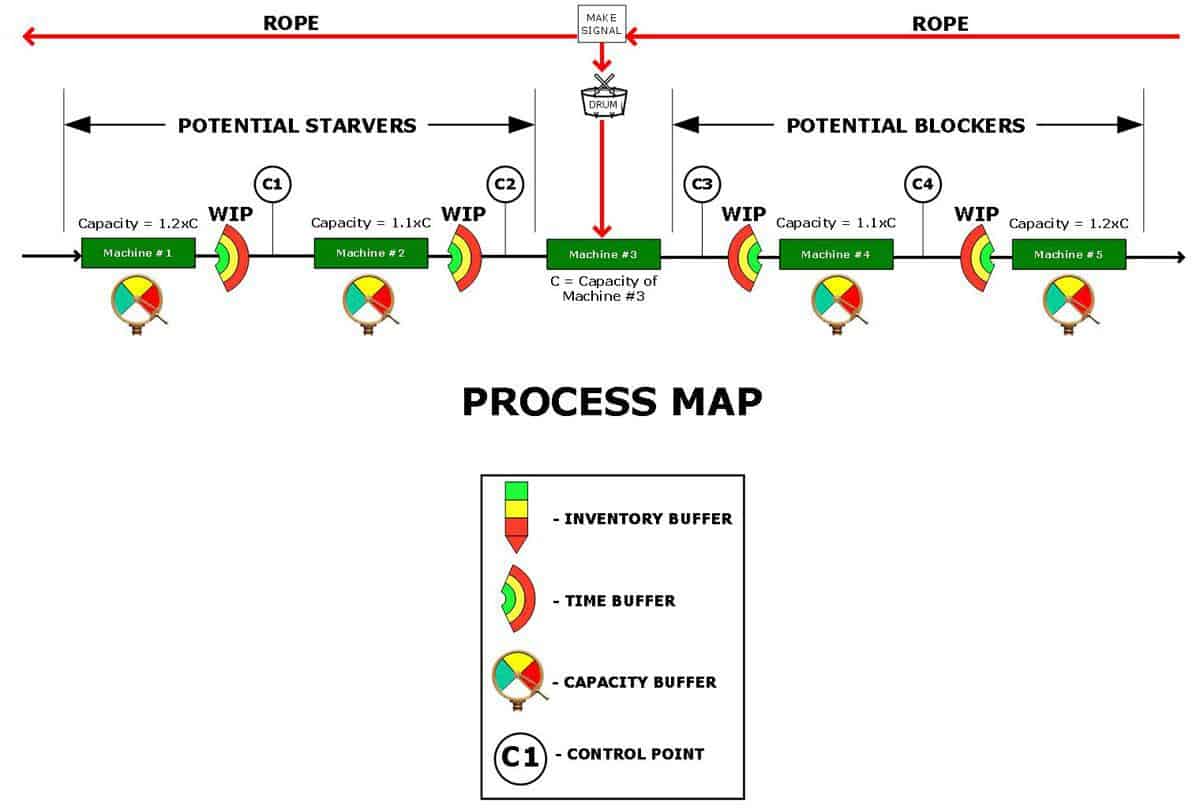
Process maps for flow lines used in the process industry are often quite sophisticated, incorporating information on the statistical effects of capacity and time buffers. We use the Bullant Filters as a conceptual framework that makes it easier to create and communicate these process maps.
There are 3 Bullant Filters:
- Demand Filter – Key operational metrics derived from the expected factory demand. This information is displayed on the process map at the Drum.
- Capacity Filter – An analysis of the capacities and buffers along the flow line. This is then represented visually on the process map.
- Reliability Filter – A bottom-up analysis of efficiencies for a given flow line based on the capacities and buffer sizes confirmed in the Capacity Filter. These efficiencies are then fed back into the demand data from the Demand Filter to derive total line running time and capacity.
When designing a factory, a process map should be used to confirm a bottom-up performance capability of each proposed line design.
Adjusting the Capacity & Time Buffers
The final activity, when designing a process factory, is to adjust the capacity and time buffers (depicted in the process maps) for optimal efficiencies and therefore optimal supply chain performance and ensure that this aligns with business plans.
Process factory design is an iterative process; when capacity and time buffers are adjusted, the effect of these changes need to be rolled up into the documents and maps described above and reviewed.
Here are a few tools that can be used to narrow in on the optimum capacity and time buffer design;
- Dynamic Modelling – sometimes the statistical interplay of capacities, efficiencies and time buffers must be modeled dynamically to confirm the best cost vs performance trade-offs.
- Modularisation – multiple smaller machines may provide better alignment with demand, offer more opportunities for crew flexibility and provide a means of clever standby capacity for unexpected sales opportunities.
- Workforce Agility – standardisation of assets, common technology interfaces, proximity of virtual cells (see above) all help to ensure that employees can switch between production lines making sure that capacity buffers can be flexed through a much larger range.
- Yield Maximisation – awareness of the places in the process where losses are most prevalent ensures that measures can be taken during design to minimise loss creators and reworking costs.
- Line Un-Balancing – refer to the article What is a flow line and how can it be manipulated to maximise performance? for more information on line un-balancing.
- Variability Pooling – refer to the articles What is Queue Sharing and how can it benefit may factory or warehouse? and What is Stock Aggregation and how can it benefit my supply system? for more information on variability pooling.
¹ These diagrams are taken from King, Peter L., Lean for the process industries: dealing with complexity. 2009 Taylor & Francis Group.