What does your customer value? The harsh reality is that customers often don’t care if your plant is state-of-the-art. They generally don’t care if your warehousing and transportation network is cutting edge.
Usually, what they care about is how quickly products move to and through their supermarket or factory, whether the product is to specification and safe, and whether the product is a good price.
Therefore;
- Speed
- Quality and Product Safety
- Costs (Price)
are often the crucial value-adding factors from a customer’s perspective.
So what are the key operational leverage points in your complex supply chain that deliver on this value proposition?
We believe that there are 9 major operational leverage points in a supply chain and we have arranged them under the 3 customer needs;
Speed
Another word for speed (as it relates to a supply chain) is throughput, or the pace at which profit flows through the supply chain.
Sales and marketing have a lot to do with this. Selling a widget for many times it’s cost is always a great way to fulfill the need for speed! Hence, effective communication through a comprehensive S&OP system is vital.
There are also a number of operational leverage points within the supply chain that help the sales and marketing guys increase speed.
1. Lead Time Reduction
Lead times can be reduced in one of 3 ways;
- Inventory Positioning – positioning inventory so that it is as close as possible to the customer is an obvious way of minimising lead time. Inventory can also be positioned to take advantage of the variability-smoothing benefits of stock aggregation (see What is Stock Aggregation and how can it benefit my supply system?). Both of these inventory positioning goals can be achieved by modifying an existing network or designing a completely new network.
- Pipeline De-coupling – strategic, demand-driven inventory buffers can be used to decouple parts of a pipeline, so increasing inventory turns and reducing the leadtimes as seen by the customer. This approach can reduce inventory by up to 30% for make-to-stock positions. Refer to What is the demand driven approach to inventory buffer sizing? for more details on how to set up these strategic inventory buffers.
- Supply Frequency – complex processing factories are now using a fixed-cycle-variable-volume load leveling technique, called a Product Wheels, to optimise order sizes, increase order frequencies and reduce lead times. The Product Wheel design process is used to make run length vs inventory vs lead time vs factory capacity trade-offs. See How to design a process factory that fits into a complex supply chain for more information on Product Wheels.
2. Deliver Performance
Delivery performance at a particular Control Point is made up of 5 tactical “rights”;
- Right quantity
- Right product
- Right place
- Right time
- Right quality
Delivery performance is calculated by multiplying the performance of these 5 Right measures.
The nemesis of delivery performance is variability of which there are 4 types;
- Demand Variability
- Supply Variability
- Operational Variability
- Managerial Variability
Variability can be controlled with the strategic placement and design of buffers. There are only 3 types of buffer in a supply chain;
- Inventory buffer
- Time buffer
- Capacity buffer
Once buffers are in place and delivery performance has stabilised at an acceptable level, improvements can be made to reduce the size of the buffers.
See 10 high-powered building blocks that simplify the way you look at your complex supply chain for more information on buffers, Control Points and their broader supply chain implications.
3. Supply Chain Responsiveness
A modern supply chain must be capable of responding to sudden disturbances. Often, this responsiveness is part of a business’s supply strategy and a point of competitive difference.
Sudden disturbances in a supply chain are different to the “common cause” variation experienced in a stable supply chain. Common cause variation can be described statistically and follow a normal probability distribution.
Sudden disturbances, called “assignable or special cause” variation, can push a supply chain system out of control and make it unstable. Examples of special cause variation in a supply chain can include;
- a customer stock take error that causes a sudden demand spike
- an unanticipated order from a customer caused by a competitor’s short supply
- an opportunity to take advantage of a spot buy of cheap inputs
- a sudden factory bottleneck caused by poor equipment installation
- an unforeseen quality issue requiring that inventories be rebuilt quickly
The extent to which a supply chain is responsive, and is capable of absorbing special cause variation, is determined by the extent to which buffers have been designed to flex (see the 3 buffer types above). Here are 2 examples of clever buffer flexing that averted possible supply disasters;
- A supply director is asked to respond to a 30% increase in customer demand after a competitor’s factory was demolished in a fire.In previous years the supply director had been careful to retain certain modular assets in the factory which were old and fully depreciated and yet still serviceable. Also he had maintained a constant ratio of trained permanents and casuals which gave him the ability to flex crewing very quickly.These 2 factors, combined with the judicious increase in overtime, meant that the supply director could dramatically increase, or flex, the size of his capacity buffer and respond to the sudden increase in demand.
- A customer stock-take error creates a 15% increase in demand on a 3rd party suppliers factory.The customer says that the shortfall must be replenished within 8 weeks. The supplier’s production line is 90% utilised and supplier tells the supply director that they are unable to respond to the sudden demand increase.The supply director knows that she can flex her inventory buffer because this is a seasonal product and they use larger inventories in the peak season to manage demand (it is currently the low season).Collaborating closely with the supplier and the customer, the supply director instructs her planners to reduce the number of product changeovers required at the supplier’s plant (i.e. increase the supplier’s capacity buffer) and to forecast the customer demand increase (surge) in 4 weeks.She also instructs her planners to immediately increase finished goods inventory (i.e. flex the inventory buffer) to dampen the demand surge, thus averting a supply disaster for the customer and securing a supplier of the year award.
4. Bottleneck Management
A system to manage bottlenecks within manufacturing supply chains was codified in the late 80’s by Dr Eliyahu Goldratt, and introduced to the world when he published his first book called, The Goal, in 1984. This system is known as the Theory of Constraints (TOC).
Goldratt was a physicist and he used his understanding of pure maths and statistics to create a logical approach towards supply chain management that went well beyond his many introductory business novels.
Almost any production operator can grasp the concept of bottleneck although the challenge lies in understanding how manipulating that bottleneck impacts the rest of the supply chain.
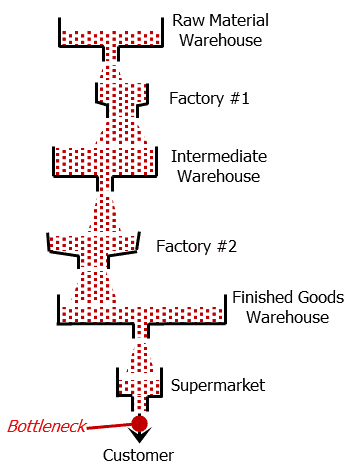
The picture below shows a healthy supply chain where the bottleneck is the customer.¹ This is the best place for a bottleneck in a supply chain because it ensures optimum delivery performance.
The important characteristics of a bottleneck are;
- flow (speed) is slowed by the bottleneck
- material accumulates before the bottleneck
- subsequent resources in the process are starved from supplies as the bottleneck cannot deliver enough to saturate them
To illustrate the behaviour of bottlenecks, and the nature of bottleneck management, we’ll show what actually happened to this supply chain.
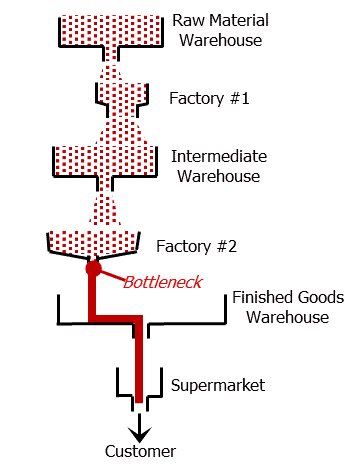
The supply director was suddenly informed that supermarkets were threatening to de-list this product because of exceptionally poor delivery performance. The supply director asked his planning team to represent the current state of the supply chain using simple funnels. With discussion it took them 15 minutes.
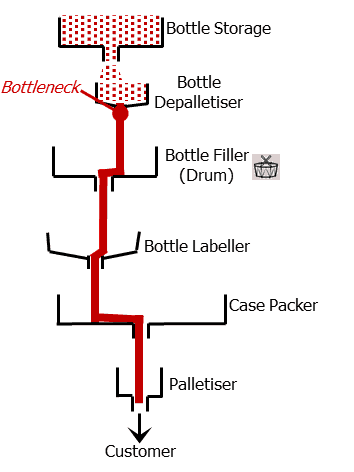
The supply director organised a teleconference with his team at Factory 2 and asked them to create a similar diagram for their factory, specifically in relation to the product that was at issue. 1/2 an hour later they produced the following diagram.
Another teleconference revealed that the bottle supplier for this product had been changed 3 weeks prior and the bottles had a high defect rate causing constant crashes at the bottle depallestiser (this is special-cause variation and meant the supply chain was now essentially unstable).
The supply director marshaled his buying team into action and came up with a short and medium term strategy to rectify the situation. He also made a mental note to find a way of delegating and communicating bottleneck management.
For more information on bottleneck management in factories please go to our article – What is a flow line and how can it be manipulated to maximise performance?.
Quality & Product Safety
The Six Sigma literature is a great resource for tools that help improve quality within a supply chain.
The challenge is to decide where to invest time, effort and resources using these and other quality tools. There are 2 important quality related leverage points;
5. Control Point Prioritisation
There are many operational Control Points in a supply chain (see 10 high-powered building blocks that simplify the way you look at your complex supply chain for more information on Control Points).
There are 2 tools that can be used to identify the Control Points that must be bolstered with additional quality analysis and monitoring. Both rely on marketplace and customer preference data;
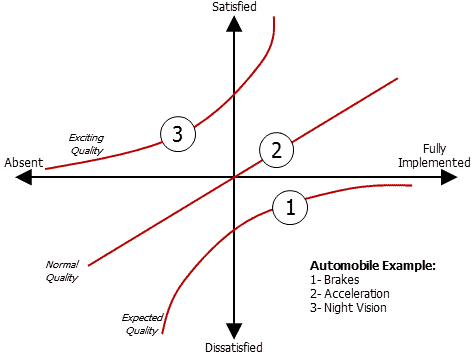
- Kano chart – customer preference data (from warranty logs, customer complaints, call centre logs, etc) can be classified by plotting it on a Kano chart. The graphic below² shows a sample Kano analysis from the car industry. In this example, 3 customer requirements are identified for the automobile:
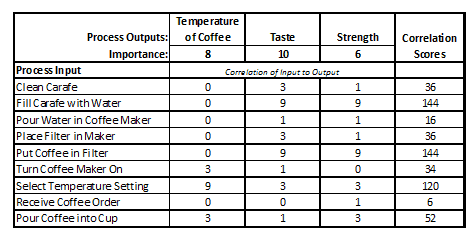
- Cause-and-effect matrix – this is a way a capturing those points in a process that are the most important from a customer quality perspective. The graphic below² shows an example of a cause-and-effect matrix (for coffee at a truck stop). Processes with the highest correlation score have the strongest relationship to customer needs.
6. Quarantine Reduction
The process industry generally, and food manufacturing specifically, often quarantine finished product in order to check a vital quality aspect of the product (e.g. seal integrity and therefore potential product spoilage at a food manufacturer) after a prescribed incubation period.
Encouraging a reduction in allowable quarantine levels forces good minds to come up with ways of controlling the process more reliably at the source (e.g. in this case the process that creates the seals).
Instigating a statistically valid process monitoring system such as a traffic light system at the crucial process (e.g. sealing machine) has a number of benefits;
- the incubation quantities can be scaled back to sampling according to the traffic light status at the time of production
- traffic light systems give immediate quality feedback to the operators at the machines
- a culture of right-first-time is reinforced
- inventory carrying and logistics costs associated with the quarantined product are reduced
- quality personnel are lees involved in administrating the quarantine system and can provide more assistance with root cause analysis creating a virtuous circle.
Cost (Price)
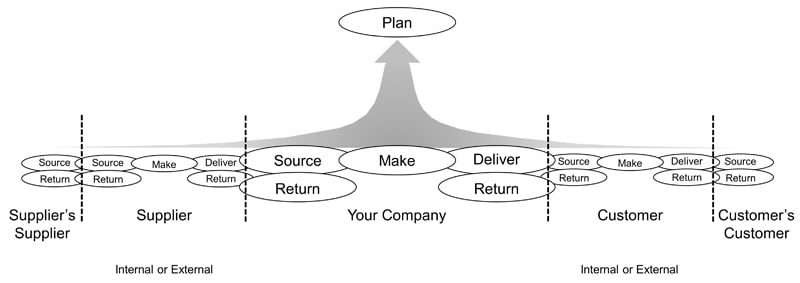
Costs are obvious, cost relationships are not so obvious. A glance at the APICS Supply Chain Operations Reference (SCOR™) framework² below shows how intertwined supply chains are and how exposed they are to weakening when anyone takes a one dimensional view. For example, if reducing costs also reduces speed and quality then this must be recognised and trade-offs understood and negotiated throughout the supply chain.
7. Input Costs
Whether purchasing a commodity for internal supply operations or purchasing a finished product from an external manufacturer, purchasing managers have a fantastic ability to enhance or cripple a supply chain. The purchasing managers that cripple a supply chain are the ones that focus solely on;
- consolidating volume
- negotiating minimum price
The purchasing managers that enhance the capability of a supply chain have these skills AND add maximum value by using;
- Interpersonal skills (handling people, having respect for others’ opinions)
- Team skills and facilitation (knowing when to be the leader and when to be the adviser)
- Analytical problem solving skills (translating knowledge into a total supply chain total cost-to-serve evaluation)
- Technical skills (supplier relationships in the process industry are (should be) longer because supply chain optimisation in the process industry is driven by process improvements)
- the list goes on (commercial acumen, computer literacy, ……)
The role of purchasing manager in the process industry should be extremely complex and extremely important and resourced with that it mind.
8. Operational Costs
There are many initiatives within a business that reduce operational costs from minimising waste in transactional processes (eg. accounts payable) through to reducing manufacturing costs.
The biggest impacts on logistics costs (such as transport, warehousing and storage costs) are usually delivered through network restructuring supported by supplier and customer collaboration.
Manager’s searching for conversion cost savings at internal or external supply facilities rely heavily on broad-based continuous improvement systems with a focus on initiatives such as;
- De-bottlenecking and buffer adjustment
- Downtime reduction/efficiency improvement
- Capacity improvement
- Lean/Six Sigma
- Pack/input consolidation and optimisation
This can lead to much wasted effort when these initiatives cannot point to broader supply chain benefits.
Also, costs within a complex factory, particularly the type found in the process industry, are not completely variable. There are usually cost thresholds that need to be breached in order to deliver savings and gradual improvements such as downtime reduction and efficiency improvement should be pursued with this in mind.
To illustrate this we have created a very simple example:
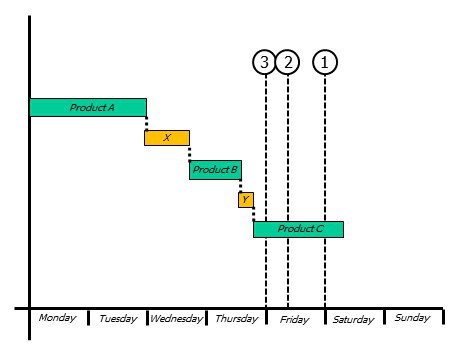
Below is a Gantt chart showing a standard production week (derived from a Product Wheel) for a processing line. The supply team decided to make (what was) a broad-based continuous improvement effort more focused and outcome-driven.
The team decided to increase the instantaneous capacity and running efficiency of products A and C as well as reducing the time taken for changeover X. They have communicated to the business that they will deliver cost savings as they pass through cost thresholds 1 thru 3;
- Casual labour reduction as a result of not supporting the Saturday shift
- Maintenance overtime reduction as the production line is made accessible on Fridays
- Inventory (cash) and warehouse cost reduction provided by the ability to increase the number of changeovers on the line.
The team decided to cease all work currently underway on reducing the time taken on changeover Z because it wasn’t even required on the standard production schedule (i.e. it wasn’t required for the Product Wheel).
9. Asset Costs
Customer’s focus on Speed, Quality and Costs (Price) whereas owners of the business (arguably the most important people) focus on the Return on Total Assets employed.
Current assets, mainly the cash tied up in inventory, is often viewed with a lot of ambivalence. Inventories are viewed as assets and reducing inventories can cause a short term reduction in profitability and a reduction in the recoveries at internal and external supply locations.
However, broader collaboration between supply sources and network managers, as well as some short term fiscal pain, can lead to longer term cost reductions as the pipeline becomes more efficient and better aligned with demand. This in turn drives reduced expedite related expenses as well as reduced warehousing and logistics costs.
Finally, fixed assets always benefit from a customer focus. Increasing Speed (i.e. the pace a which profit flows through the business) improving Quality and reducing Costs, while using the same fixed assets, will always increase the return on fixed assets. This is a great virtuous circle!
¹ – the credit for this diagram goes to Philip Marris, founder and owner of Marris Consulting, France.
² – taken from Supply chain excellence: A handbook for dramatic improvement using the SCOR model, P Bolstorff and P Rosenbaum, 3rd Edition. AMACOM 2012.


